Portfolio exposure

Property Risk and Resilience Screening

We place every building footprint against flood zones, terrain, hail and wind history, wildfire fuel, heat and visible roof vulnerability, then rank the portfolio. The first 3 are free.

Free preview: 3 properties, delivered 3 business days after we confirm your territory. No card, no call.

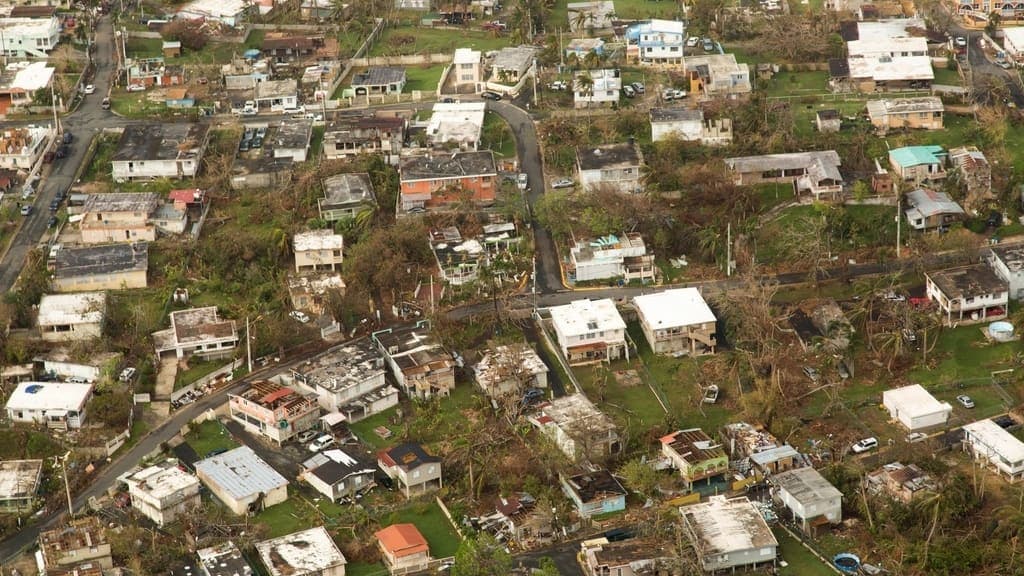
Aerial photograph of a hillside residential district after a hurricane: several roofs are stripped back to their framing, debris lies across the yards and the surrounding trees have been torn bare.
Wind damage visible from above, illustrative

Sec. 01 — The decision

A structural engineer costs four figures per building. A portfolio of two hundred buildings cannot start there.

Most risk teams already hold a FEMA map, an insurance schedule and a memory of the 2021 hail event, but no comparison where every asset was measured the same way. This puts the portfolio on one ruler.

See how the research works

Sec. 02 — Evidence

The eight exposures we measure at the building footprint, not the parcel centroid

A parcel can sit in a flood zone while the building sits on the high corner of it, and that difference decides whether an elevation certificate is urgent.

ExposureWhere it comes fromWhat it settles — and what it does not
Flood zone at the structureFEMA National Flood Hazard Layer intersected with the building footprint, not the parcelEstablishes whether the structure sits in an A, AE, VE, shaded X or unmapped area, and how much of the footprint is affected. Finished floor elevation needs an elevation certificate.
Terrain and local drainageUSGS 3DEP LiDAR-derived elevation at and around the footprintShows whether the building sits in a local low point and where sheet flow collects, which often explains repeated losses outside any flood zone. It is not a hydraulic model.
Accumulated hail exposureNOAA severe weather reports and gridded hail swaths at the parcel, dated and sizedCounts dated hail days at or above 1.0 in and 1.75 in since a chosen baseline, usually the last reroof. It does not prove damage, loss or an open claim.
Design wind contextASCE 7 basic wind speed and exposure category at the coordinate, distance to open coastEstablishes the design basis and whether the building sits in a wind-borne debris region, which drives glazing and roof-attachment requirements. It says nothing about as-built attachment.
Roof vulnerabilityAerial imagery: membrane or metal system, ballast, parapet height, unit restraint, drainageIdentifies the roofs most exposed to hail and uplift — ballasted systems in hail country, unrestrained units in high wind, blocked drains. Fastener pattern and uplift rating need an inspection.
Wildfire exposureFederal wildfire risk and fuel datasets, LiDAR slope, visible defensible-space clearanceRanks assets by fuel proximity, slope-driven fire behaviour and the clearance that actually exists today. It does not predict ignition, and vegetation changes faster than imagery refreshes.
Heat and roof thermal loadExtreme-heat day frequency, urban heat island surface temperature, roof colour from imageryFlags assets where dark low-slope membrane in a heat island pressures mechanical capacity and tenant continuity. It is not an HVAC capacity calculation.
Access and continuity geographyRoad network topology at the site, single-access conditions, adjacency to rail and industryIdentifies assets with one way in, or a hazardous neighbour, where an event isolates operations even if the building is untouched. It does not model utility restoration priority.
Scroll the table sideways for all three columns
Source vintage and known gaps

FEMA panels are revised county by county and some predate current development, so the report gives the effective date per property. NOAA storm reports are observation-based, so rural events are under-reported.

Sec. 03 — The engagement

The diligence budget goes to the assets that earned it.

One ranked comparison with the reason for each position visible, so a capital committee argues with the evidence.

  1. Define the portfolio and weightingYou provide the address schedule, the hazards that matter, and the business impact you are protecting.
  2. Measure every footprint identicallyWe intersect each footprint with the hazard layers, pull dated weather history, and review roof condition in imagery.
  3. Rank and sequence the workAn analyst orders the portfolio, records where a map is old or an observation ambiguous, and sequences diligence by cost.
Ranked portfolio register

Every asset ordered by composite exposure against the hazards you weighted, with the driving exposure named.

Hazard profile per asset

Flood zone at the footprint, terrain position, hail and wind history, wildfire and heat, each with source and date.

Roof and site observations

Roof system, ballast, parapet, unit restraint, drainage, tree overhang and defensible space from current imagery.

Confidence and vintage notes

Which exposures rest on current data, which on a decade-old panel, and where a missing record is not an absent event.

Concentration summary

Correlated exposures across the portfolio, repeated constraints, and asset groups sharing one mitigation strategy.

Diligence and mitigation checklist

The engineering, environmental, elevation and insurance work each ranked asset now needs, in cost order.

Sec. 04 — Limits

This is a screening instrument, and it is regulated territory, so the boundary matters.

We are not an insurer, an engineer, an appraiser or a modelling firm, and the report says so on its face.

Settled by the report

  • Which structures — not parcels — sit in mapped flood hazard areas, and how much of the footprint
  • Where each building sits in the local terrain and where surface water collects
  • How many dated hail and high-wind events each parcel recorded since your baseline
  • Which roofs are most visibly vulnerable to hail, uplift and drainage failure
  • Where exposure concentrates across the portfolio rather than at a single asset

Not settled — licensed work required

  • Finished floor elevation and whether it sits above the base flood elevation
  • Structural condition, roof attachment adequacy, or uplift rating as built
  • Probable maximum loss, expected annual loss, or any actuarial figure
  • Whether past events caused damage, and whether a claim or repair followed
  • Insurability, premium, coverage terms or replacement cost
The five checks that follow a screening rank
  1. Order an elevation certificate for any structure the footprint analysis places in an A, AE or VE zone.
  2. Commission a roof inspection with uplift and attachment review on the assets ranked highest for wind and hail.
  3. Reconcile the ranking against your own loss history and current insurance schedule.
  4. Engage a drainage consultant where the terrain analysis found a low point outside any mapped flood zone.
  5. Take the concentration findings to your broker before renewal, since correlated exposure is priced differently.

Sec. 05 — Questions

Where this sits relative to your insurer, your engineer and your model.

Further reading

How this screen is actually run.

The method behind this report, written out in full.

Related solutions

Other property questions we answer with the same workflow.

Solution

Commercial roofing and HVAC prospecting

The same roof and storm evidence, aimed at contractors selling the mitigation.

Explore this solution
Solution

Industrial and data center site selection

Hazard screening applied to land you have not bought yet, with utility and zoning constraints.

Explore this solution
Solution

Custom territory and market analysis

A portfolio question that does not fit a hazard screen, scoped against the sources that answer it.

Explore this solution

Start with three assets

Send us three addresses and see what the footprint analysis finds.

Give us three properties and the hazards that matter to your operation. We return the full exposure profile for each, with sources and dates, in 3 business days, free.

Get 3 free properties

3 properties · 3 business days · no card

3 properties, freeNo card · 3 business daysStart free